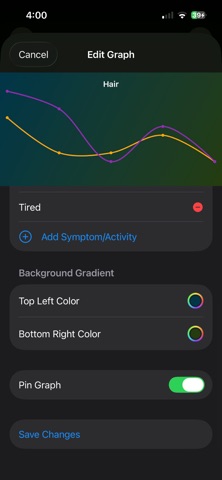
Discover how your good habits and activities effect your symptoms with clear visual graphs
Discover how your good habits and activities effect your symptoms with clear visual graphs.

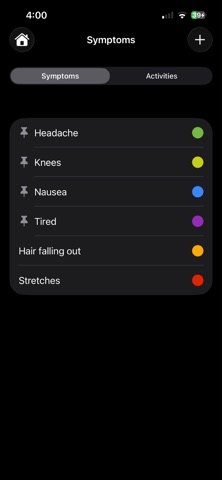
- Create a list of custom symptoms.
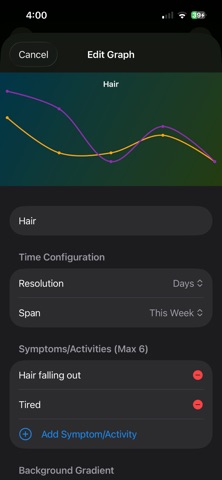
- Create custom graphs with custom color coding.
	- custom time spans such as the current week, this month, or a custom date range, etc.
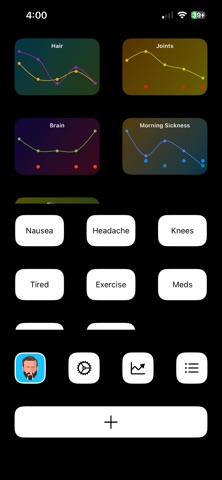
- Pin frequently used symptoms and graphs to the dashboard for easy tracking.
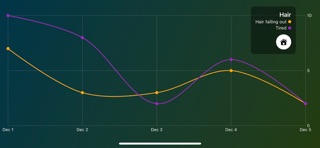
- Compare multiple different symptoms and activities together on one graph.
- Set daily or weekly notifications to track different symptoms or habits (activites).

Track your symptoms AND habits together in the same space, and see clear graphs that show you how the activities in your life affect your symptoms.

Created for my wife, with love.

Standard app store policies apply. Data is stored on your iPhone.