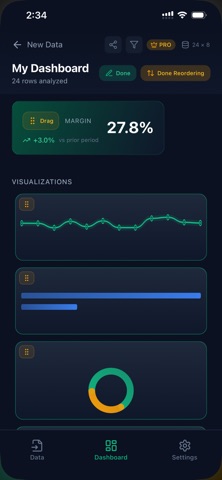
STRING EX turns spreadsheets into clear dashboards, KPIs, charts, and visual reports
STRING EX turns spreadsheets into clear dashboards, KPIs, charts, and visual reports.

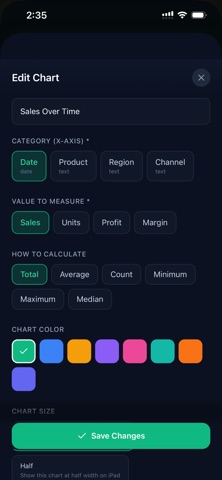
Import Excel or CSV data, organize it quickly, and create business visuals without getting buried in spreadsheet complexity. STRING EX is built for people who need answers from their data, not another maze of formulas, tabs, and manual formatting.

Use STRING EX to:
• Turn spreadsheet tables into charts
• Build KPI views from business data
• Explore trends across time periods
• Compare categories and performance
• Create cleaner visual reports
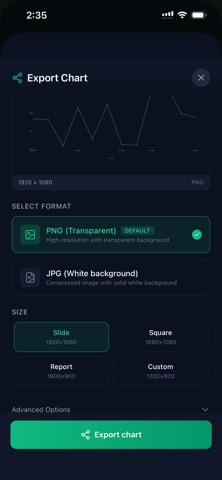
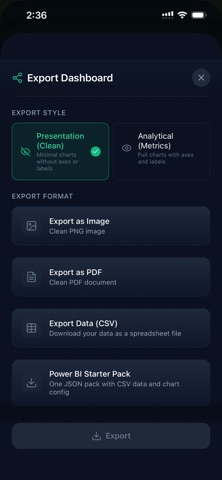
• Export charts for presentations and reporting
• Work with data in a faster, more intuitive way

STRING EX is useful for:
• Finance teams
• HR teams
• Operations teams
• Managers
• Analysts
• Business owners reviewing performance data

Whether you are reviewing sales, headcount, expenses, operations, or other business data, STRING EX helps turn messy spreadsheets into decision-ready insight.

Less spreadsheet friction. More clarity.

Terms of Use: https://www.apple.com/legal/internet-services/itunes/dev/stdeula/